What each chart and report page is actually telling you.
The landing page shows a few sample outputs, shrunk down to fit a card. Here is what each of them means in full — plus the three "Refining Results" tools, which run inside the app after a Run Assessment completes.
The screening curve
This is the Design-Based Verification step referenced at the top of the landing page. For each component, HeaterIntegrity takes the elastic and rupture allowable stresses for its material from the API 579-1 Part 10 screening curves.
In the app, each assessed component is plotted as a point on its material's curves: its actual operating stress at its actual metal skin temperature. The allowable stress at that temperature is the reference value the plastic-collapse check (next section) compares the component's hoop stress against, and the rupture value the creep-damage calculation uses. It isn't a separate pass/fail gate ahead of the Level 2 assessment; it's the standard's own reference data feeding directly into it.
The failure-modes dashboard

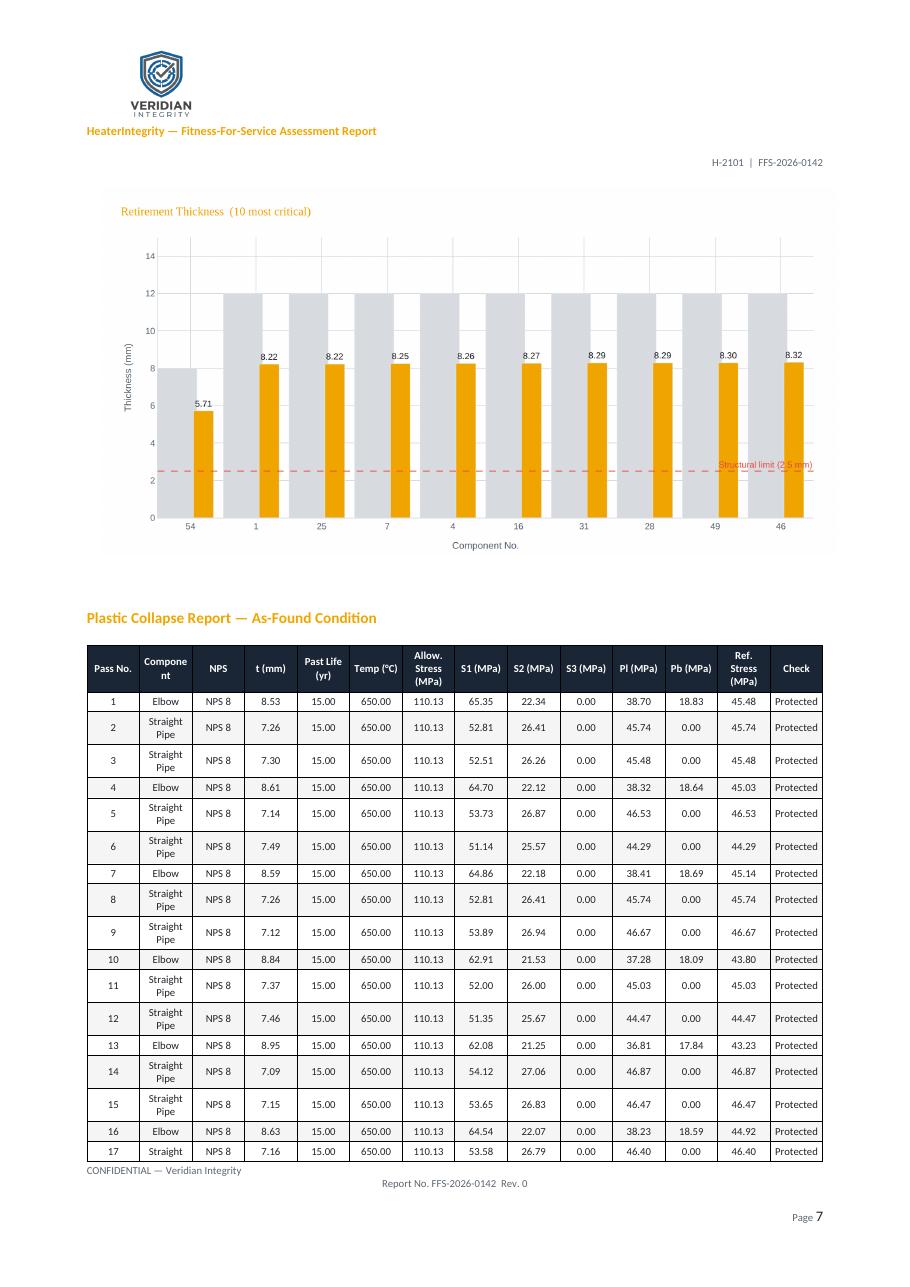
Every component in the section gets checked against both ways a tube actually fails in service:
- Plastic collapse — is the current wall thickness, at current pressure and temperature, still enough to hold the load at all? This is the fast, thickness-driven check.
- Creep damage — how much of the material's life-limiting creep-rupture life has already been consumed, running continuously at the operating temperature? This is the slow, time-and-temperature-driven check, and it's what usually governs for fired-heater and boiler tubes running in the creep range.
The remaining-life ranking combines both checks and sorts every component from most to least critical, so the ones that need attention at the next turnaround are immediately obvious instead of buried in a spreadsheet. A component labeled "creep-governed" means its remaining life is set by the creep calculation, not by how thin it's gotten — the two can disagree, and knowing which one is driving the number changes what you'd actually do about it (metallurgical sampling vs. a thickness re-measurement, for instance).
The full engineering report
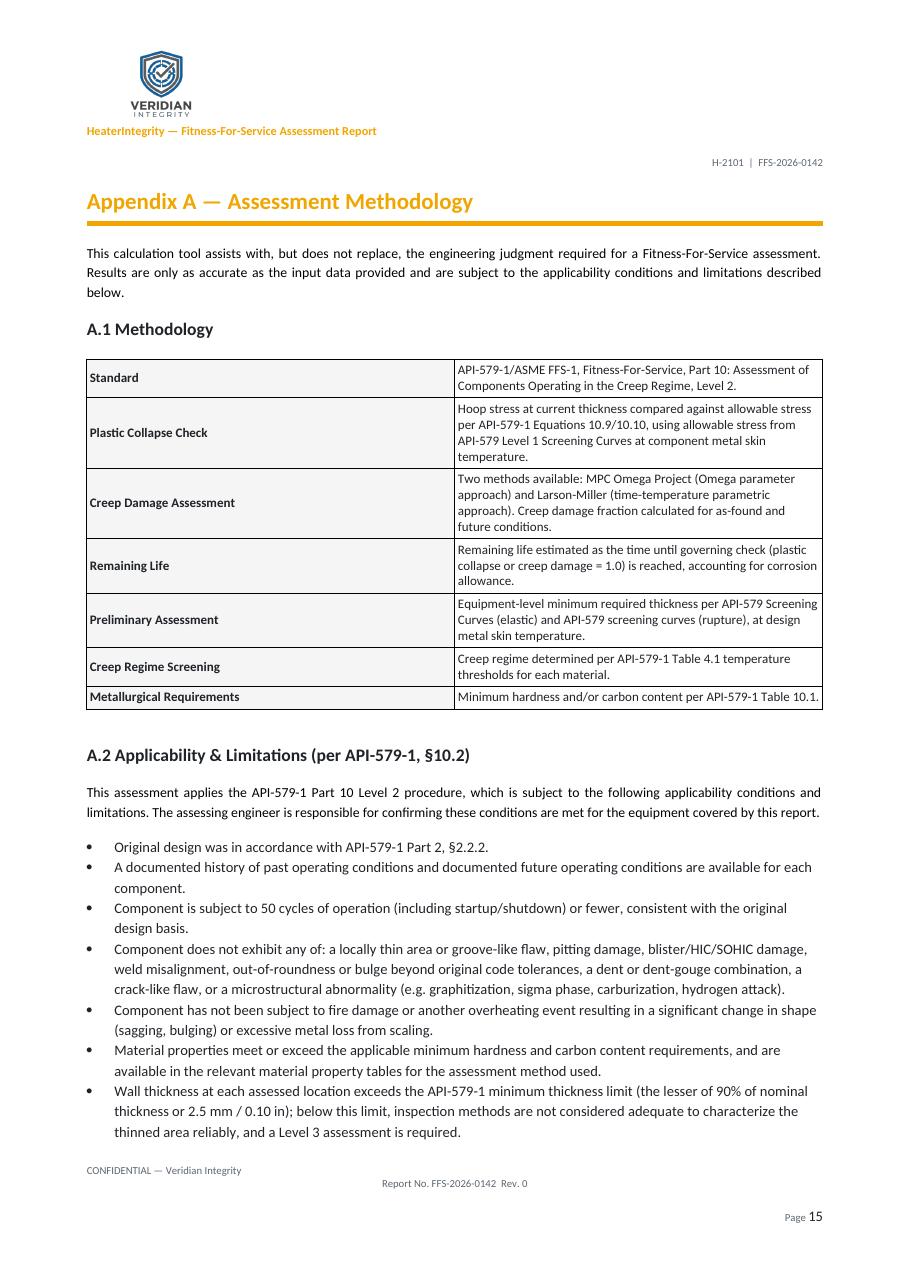
The landing page only shows the cover. The report itself — generated as an editable Word document, on your own firm's letterhead, in one click — runs to the full assessment: every component's plastic-collapse and creep-damage numbers, the charts above, and an appendix documenting exactly which method and equations were used, so the report stands on its own in a design review or an audit.
Refining Results — three tools for "what if"
These run inside the app after a Run Assessment completes, on real components from the example above — they're often where the actual engineering judgment gets applied.
Temperature Sensitivity
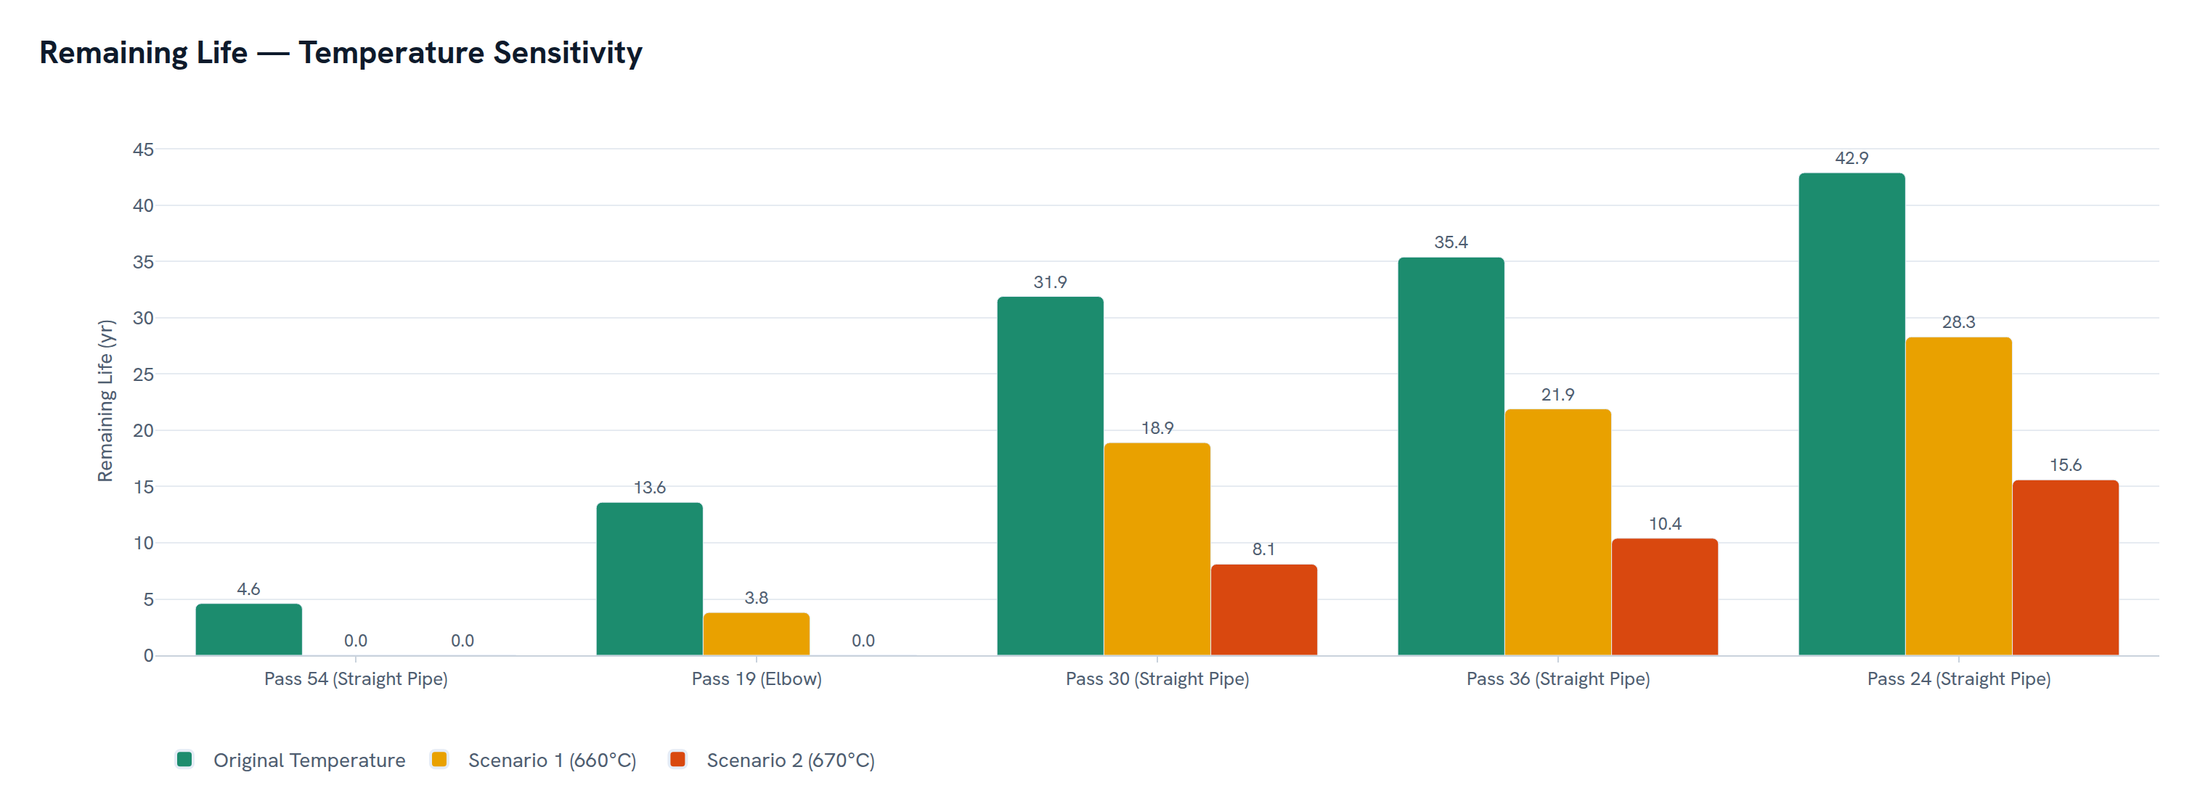
Re-runs selected components' remaining life at up to two alternate metal skin temperatures you specify, keeping everything else — method, material, thickness, past life — exactly as entered. Useful when you're not fully certain of a component's actual operating temperature and want to see how much that uncertainty actually matters: here, a 10–20°C swing collapses some components' remaining life to zero while barely touching others, depending on how close each one already runs to its limit.
Temperature Excursion

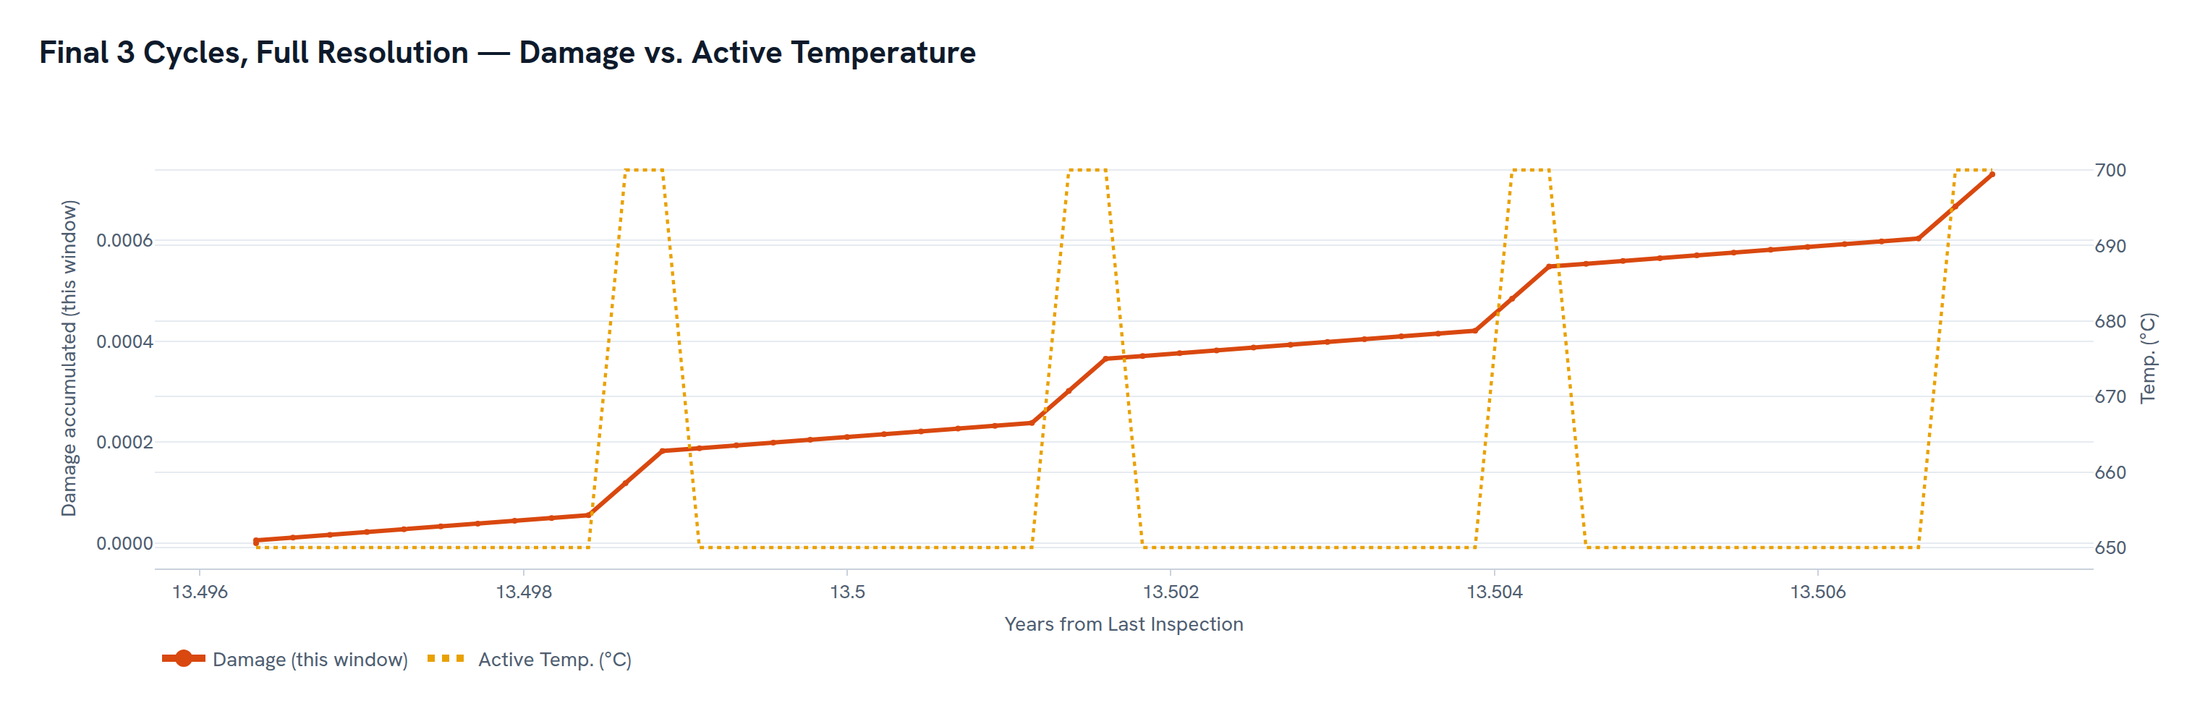
Models a repeating temperature block — for example a documented flame-impingement or coking event — and projects its effect on cumulative creep damage going forward from the last inspection. Past-life damage is never re-derived; only the forward projection changes. In this example, a component with 29 years of remaining life under normal operation drops to about 13.5 years once a 2-hour/700°C, 22-hour/650°C daily cycle is added — with the zoomed final-cycles view showing almost 70% of that damage accumulating during the short hot portion of each cycle, not the longer normal portion.
Creep Properties Comparison
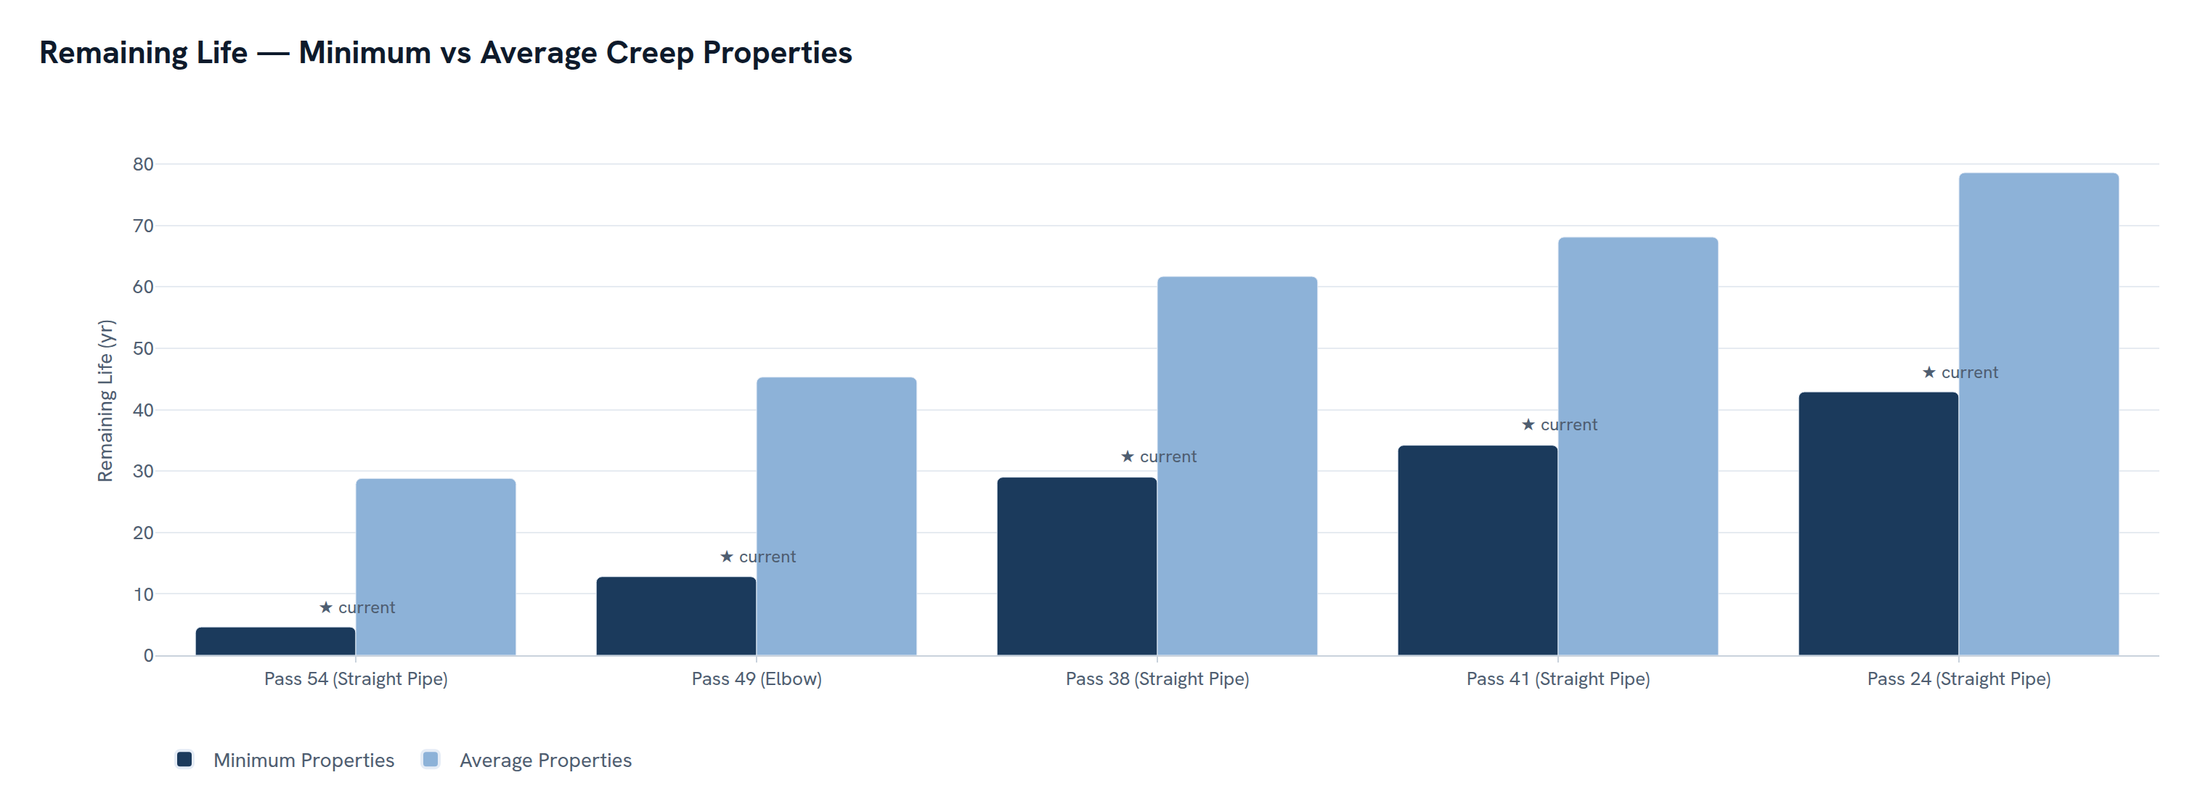
Re-runs selected components under a different creep-properties basis — Minimum Properties, Average Properties, or (when entered) User Defined — than the one the section currently uses, so you can see the spread between a conservative and a best-estimate answer without setting up a second assessment. Here, every component was assessed on Minimum Properties (★ current); switching to Average Properties roughly doubles the estimated remaining life across the board — a gap worth knowing about before deciding which basis to report.